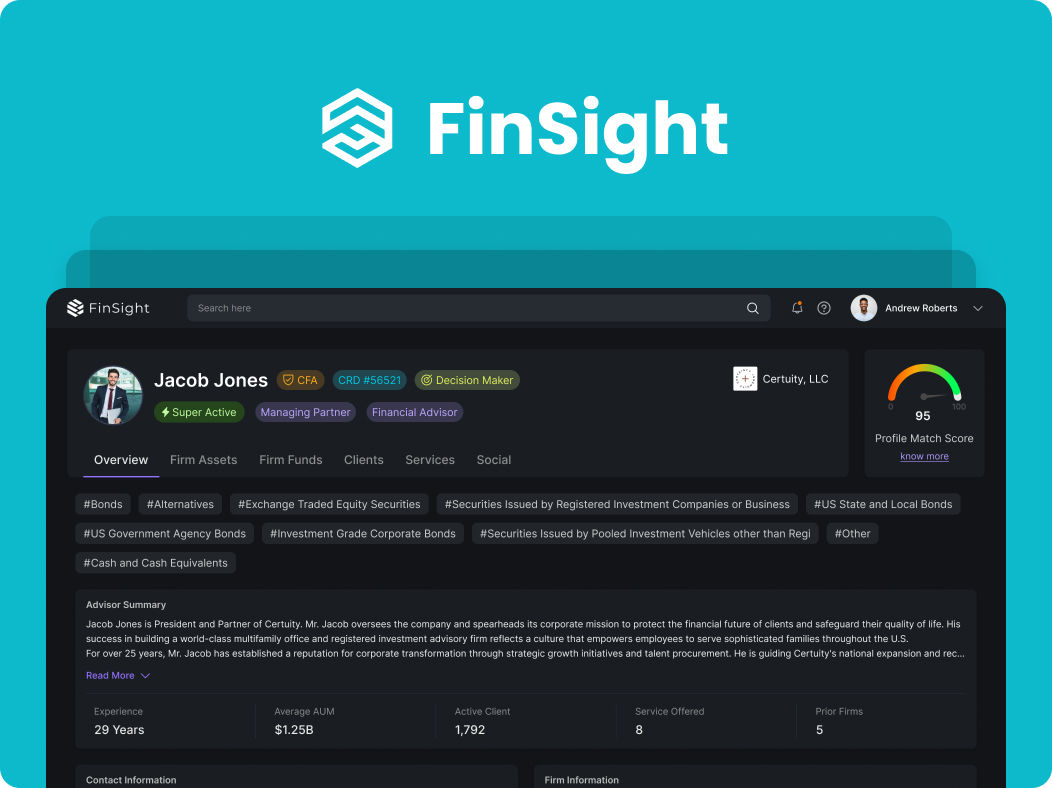
FinSight / Advisor profile redesign
A clearer picture behind
every advisor profile.
Helping wealth managers find, interpret and compare advisor and firm information—without losing the detail that matters.
What I designed
Subject-based navigation across the advisor profile
Allocation charts and lists for different reading needs
Count, percentage and amount for comparison
Summaries and deeper information within a shared structure
The short version
From collected data to a usable profile.
The problem
Wealth managers moved between funds and clients to compare a year’s information. Dense values required repeated reading and cross-checking.
My response
I grouped information by topic, paired charts with detailed values, and designed a path from profile summaries to focused research.
The feedback
Four managers tested the design and felt it could ease research and save time. That feedback is qualitative; no measured time saving is claimed.
The starting point
The data was available.
Making sense of it took work.
FinSight brings advisor and firm information from multiple sources into a shared profile. Wealth managers use this information to understand a firm’s funds, clients, assets and services.
My focus was the profile experience. I conducted interviews and task observations, reorganized the information and designed a new interface within the existing brand. The aim was to make the profile easier to explore while keeping detailed information accessible.
FinSight is the white-label presentation of this work for my portfolio. My contribution covers the profile redesign, rather than the full platform or its original branding.
01 / Research
I started with how people research.
Interviews and task observation helped me understand which details wealth managers needed, where they expected to find them and how they compared information.
across the project
tested the design
Direct conversations and observed tasks informed the structure and presentation of the profile.
Recognize the pattern.
Then inspect the detail.
Participants preferred visual representations to text alone when interpreting information. The design needed to support quick recognition without removing the underlying values.
Comparison crosses
section boundaries.
Participants moved between funds and clients to understand a particular year. Client count, percentage and monetary value each helped answer a different question.
One observed research task
From a yearly picture to a specific filing.
- 01Choose a year
Establish the period being researched.
- 02Review Firm Funds
Understand the funds associated with the profile.
- 03Compare Clients
Relate client types and counts to each group’s AUM.
- 04Open a filing
Use a fund card’s KPIs to identify the relevant record.
The participant moved back and forth between funds and clients before opening a filing. This sequence describes the observed task; it is not a claim that research follows a fixed, linear path.
02 / Information architecture
Organize around the questions people ask.
The earlier profile grouped information into Basic Information, Advanced Information and Intelligence. I reorganized the profile into recognizable subjects, using a broad, shallow structure so users could choose a topic without navigating through several nested levels.
A structural comparison of the original and redesigned interfaces. The screens contain different example profiles and data. Select a screen to inspect it.
- OverviewWho am I researching?
- Firm AssetsHow are assets allocated?
- Firm FundsWhich funds are involved?
- ClientsWho does the firm serve?
- ServicesWhat does it offer?
- SocialWhat is it sharing?
Design decision 01 / Visual interpretation
A distribution you can see.
Details you can still inspect.
Asset-allocation data arrived from the API in a spreadsheet-style format. I proposed a circular chart view to the developer so users could recognize the allocation visually, alongside a list for reading individual categories and values. In the updated design, the chart summarizes four main asset classes while adjacent groups retain their underlying breakdowns.
The updated chart groups the allocation into four main categories, with subcategories alongside it. Switch views to compare visual interpretation with detailed reading; select the screen to enlarge it.
The chart gives the distribution a visual form, helping users locate categories of interest.
The list retains space for category labels and individual figures when a closer reading is needed.
Filing information keeps the source of the displayed data within the profile view.
Design decision 02 / Comparison
One research question.
More than one useful measure.
Knowing the number of clients is different from knowing the assets they represent. I brought client counts, monetary amounts and distribution views into the profile so users could examine the same subject from different perspectives.
The scale of a client group or fund category.
A proportion, understood in relation to its total.
The monetary value represented by the group.
Summary → comparison → source
The observed workflow connected all three. Fund cards surfaced key figures to help users identify the filing they wanted to investigate further.
A closer look / Fund cards
Give the next click a reason.
During observation, managers used a fund card’s key figures to decide which filing to investigate. The design puts fund type, gross asset value, minimum investment and owner count together, so each card offers context before that next step.
The year controls sit immediately above the cards. The filing-selection behavior came from task observation; the image here shows the fund summary, not the filing itself.
Design decision 03 / Hierarchy
Start with orientation.
Let detail follow.
The overview establishes who the advisor is and introduces key profile information. A concise summary with a Read More control allows the longer narrative to sit behind an explicit action.
Topic tabs then separate focused areas of research. Within those sections, summaries and detailed cards provide different levels of information without forcing every detail into the first view.
04 / Feedback & reflection
A promising direction for
easier research.
Four wealth managers tested the redesigned profile. Their feedback suggested that the experience could ease their research work and save time.
This is qualitative feedback about perceived usefulness. No measured time saving or task-success result is available for this case study.
My takeaway
Making a dense profile usable depends on the relationships between information: how people find a category, compare its measures and move from a summary to a deeper record. The research helped me design for that sequence.
What I would evaluate next
Does context survive the comparison?
Test the funds-to-clients task with a consistent year and dataset, observing where users lose their place or need to recheck a value.
Are the visuals interpreted correctly?
Validate chart categories, percentage definitions and underlying values with the data team, then test whether users can explain what each view represents.
Experience the design
Explore FinSight for yourself.
Start on the advisor profile. Explore Firm Assets, move between Firm Funds and Clients, and follow the details that interest you. Use full screen for more room, or open the prototype directly in Figma.
Interactive FinSight prototype
Use the link above if the embedded prototype is unavailable.
Interactive design prototype. The screens use sample profile data.